|
||
|
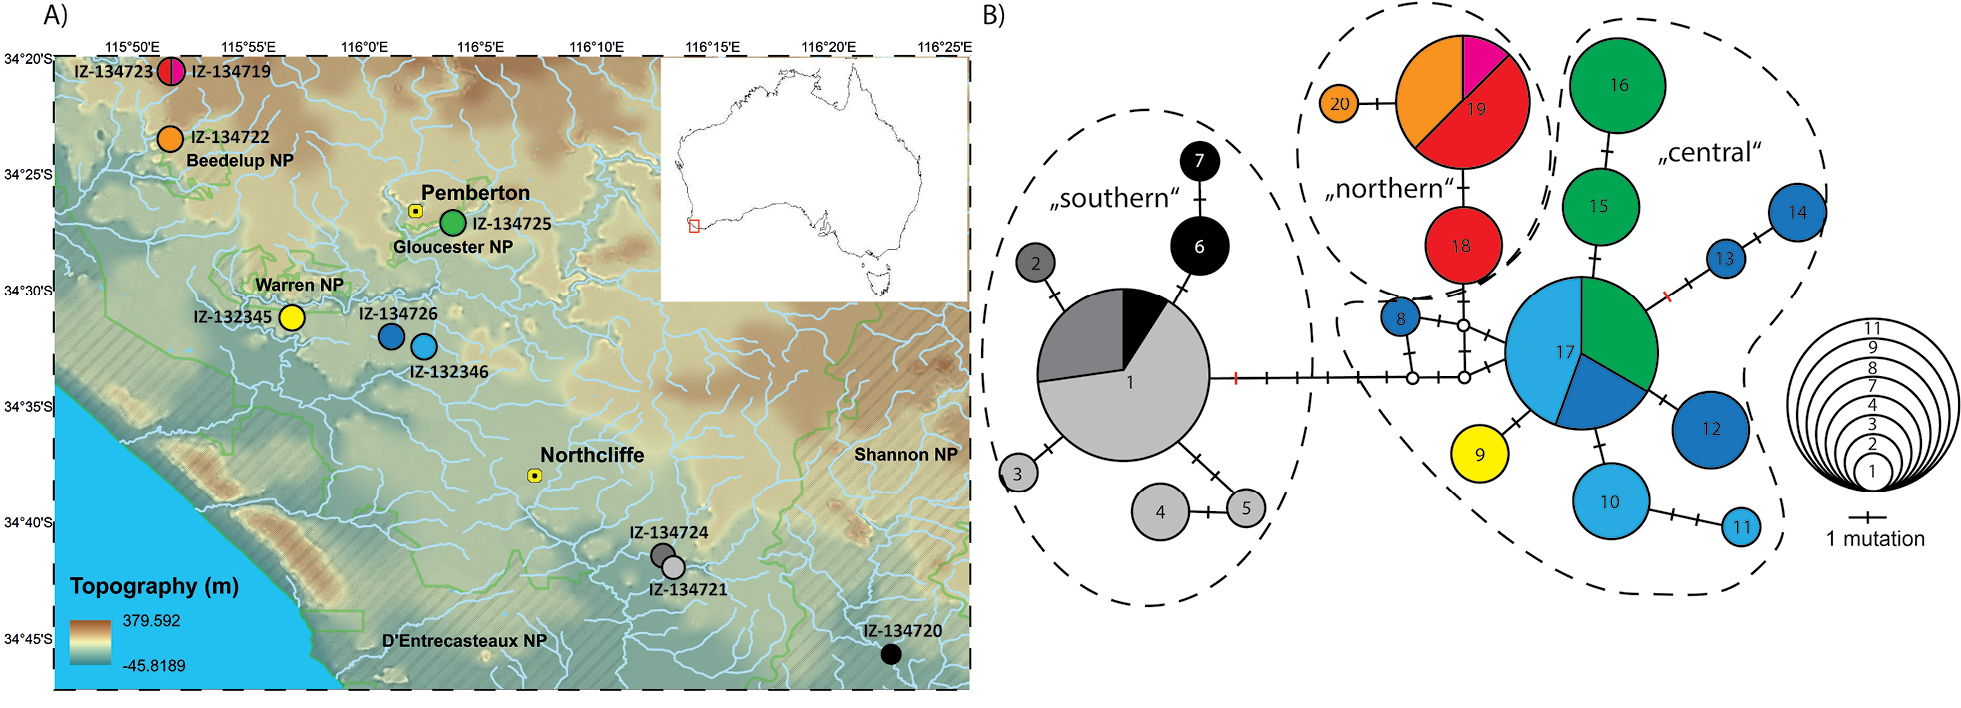
Distribution of haplotypes. A) Map of sampling localities. B) Median-joining haplotype network. Each mutation is indicated by a dash on the lines connecting haplotypes, mutations resulting in an amino acid changes are marked in red. The size of haplotypes correspond to their observed frequency as indicated by the scale and the colors correspond to the respective localities. |